CPU / GPU maxing out with bad frame rates


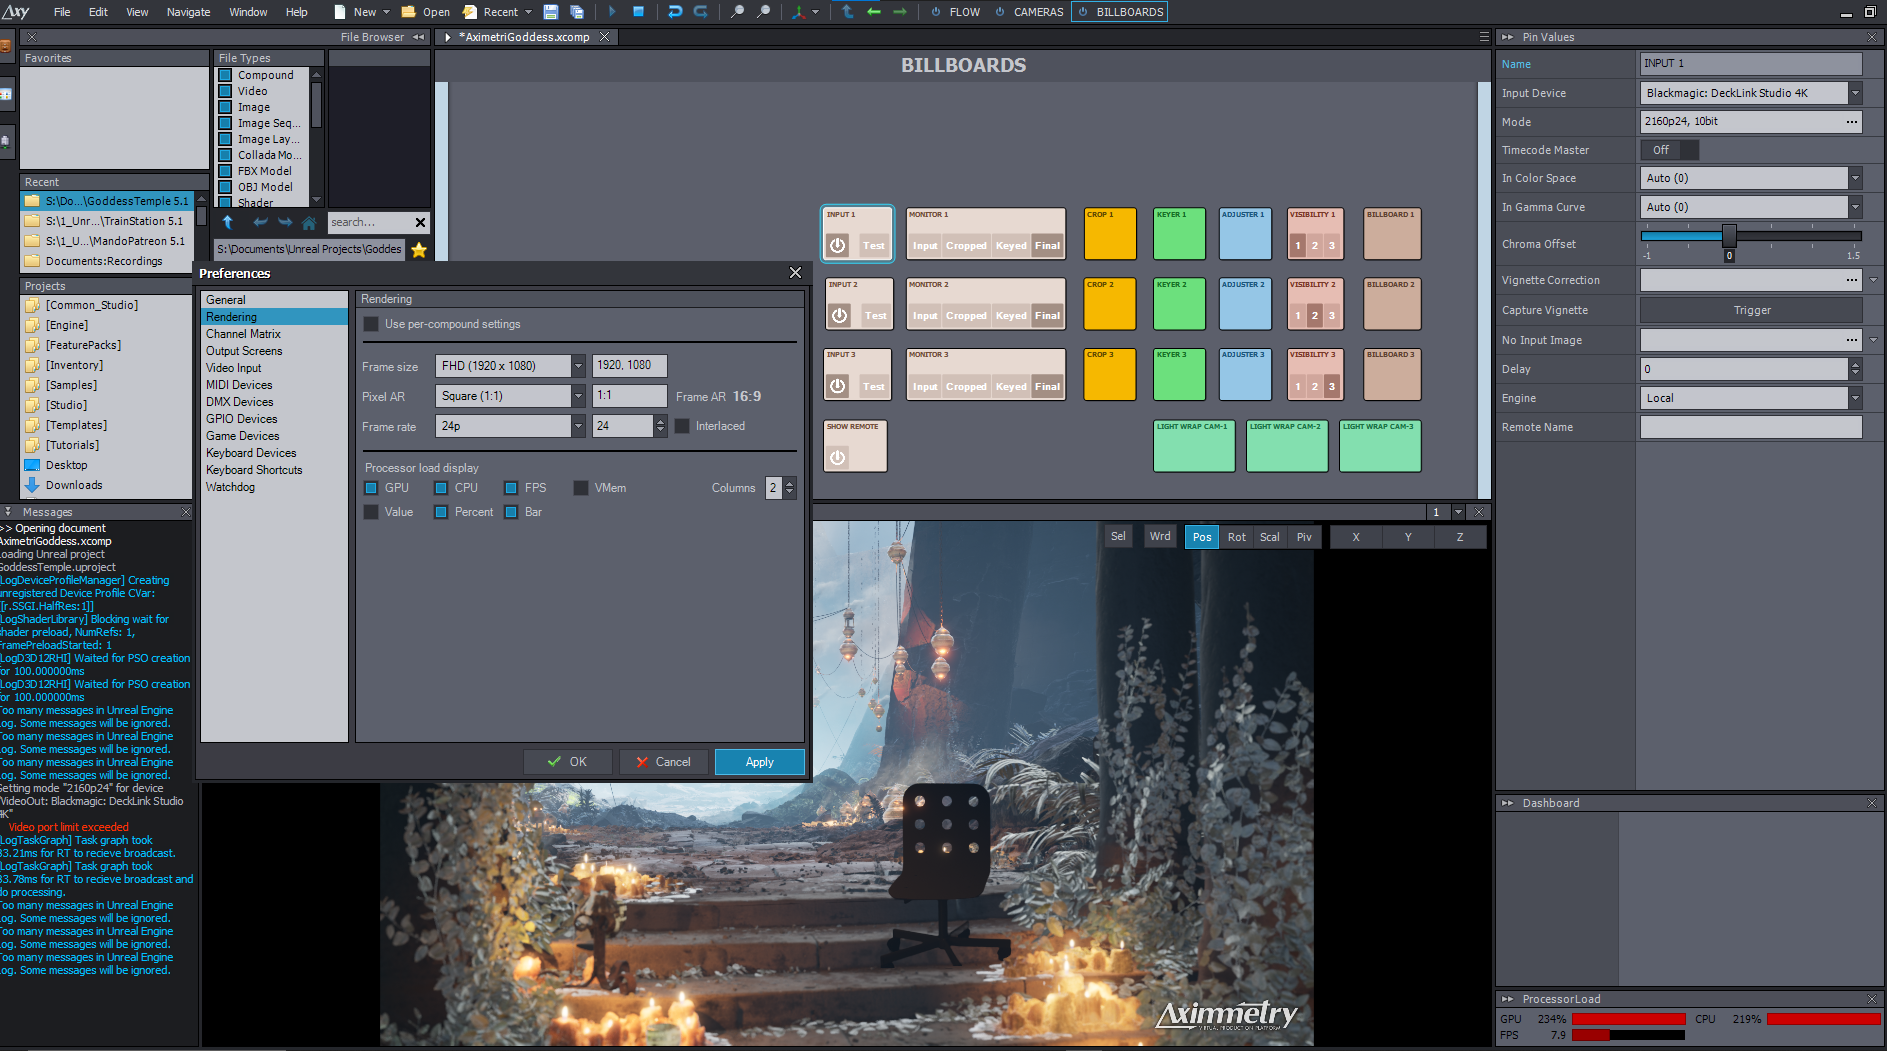
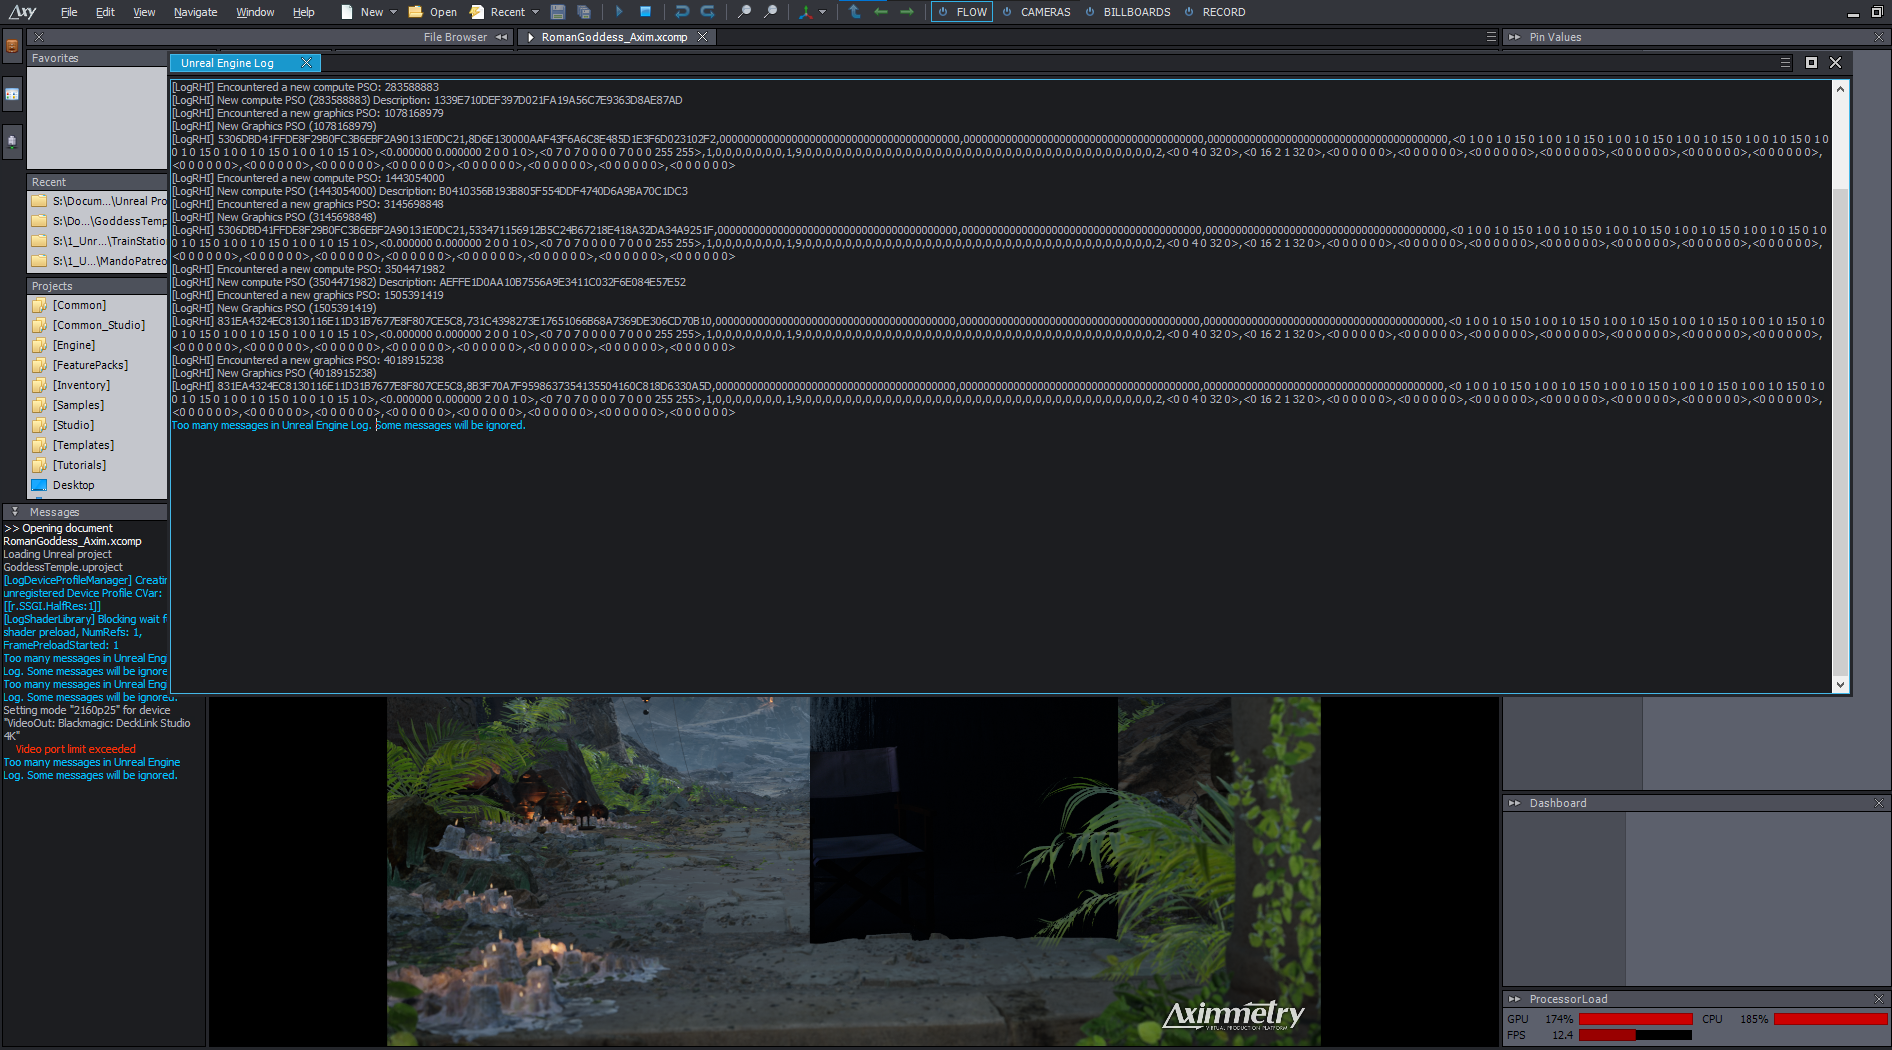
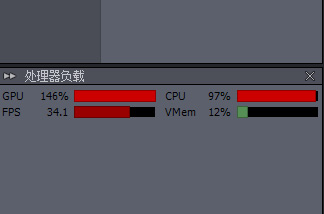
We've been using Aximmetry for over a year and with 4.27 we were doing live events with 4K resolution at 60p.  Opening some of our previous projects and updating them to Unreal 5 has caused all of them to be unusable for production.  We can't even get 24p at 1920x1080 let alone 3840 @ 60p like we were previously.

Scene has been optimized, all stationary lighting / shadows baked, scene cooked, all other programs shut off.

Hardware specs

  • Intel i9-10900X @ 3.7
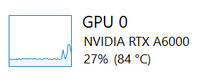
  • Nvidia A6000 GPU
  • 64GB of Ram (Definitely could up this)

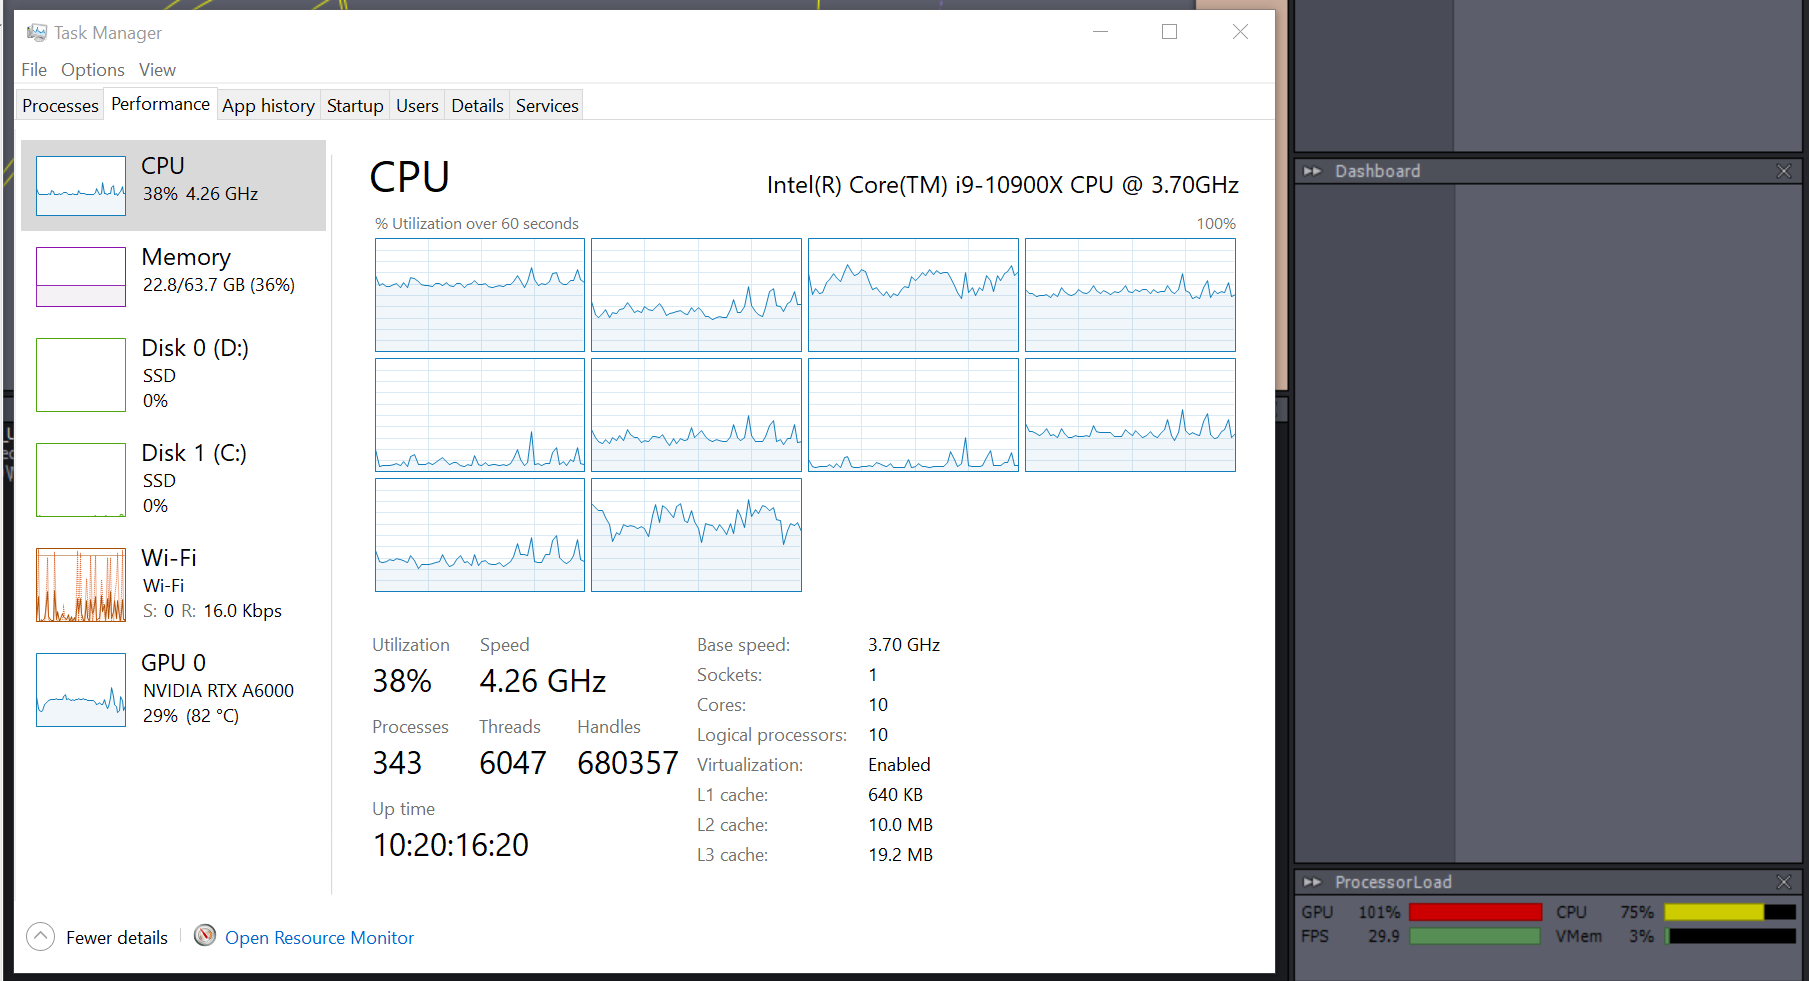
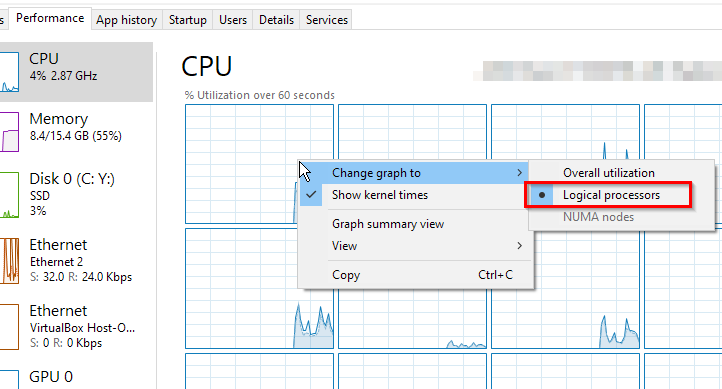
I noticed another post mentioning to turn off Hyper-Threading in the BIOS for the CPU and this honestly made it worse, still in the red all the time but the % over 100 increased.


   180Group

 
Profile Image
TwentyStudios
  -  

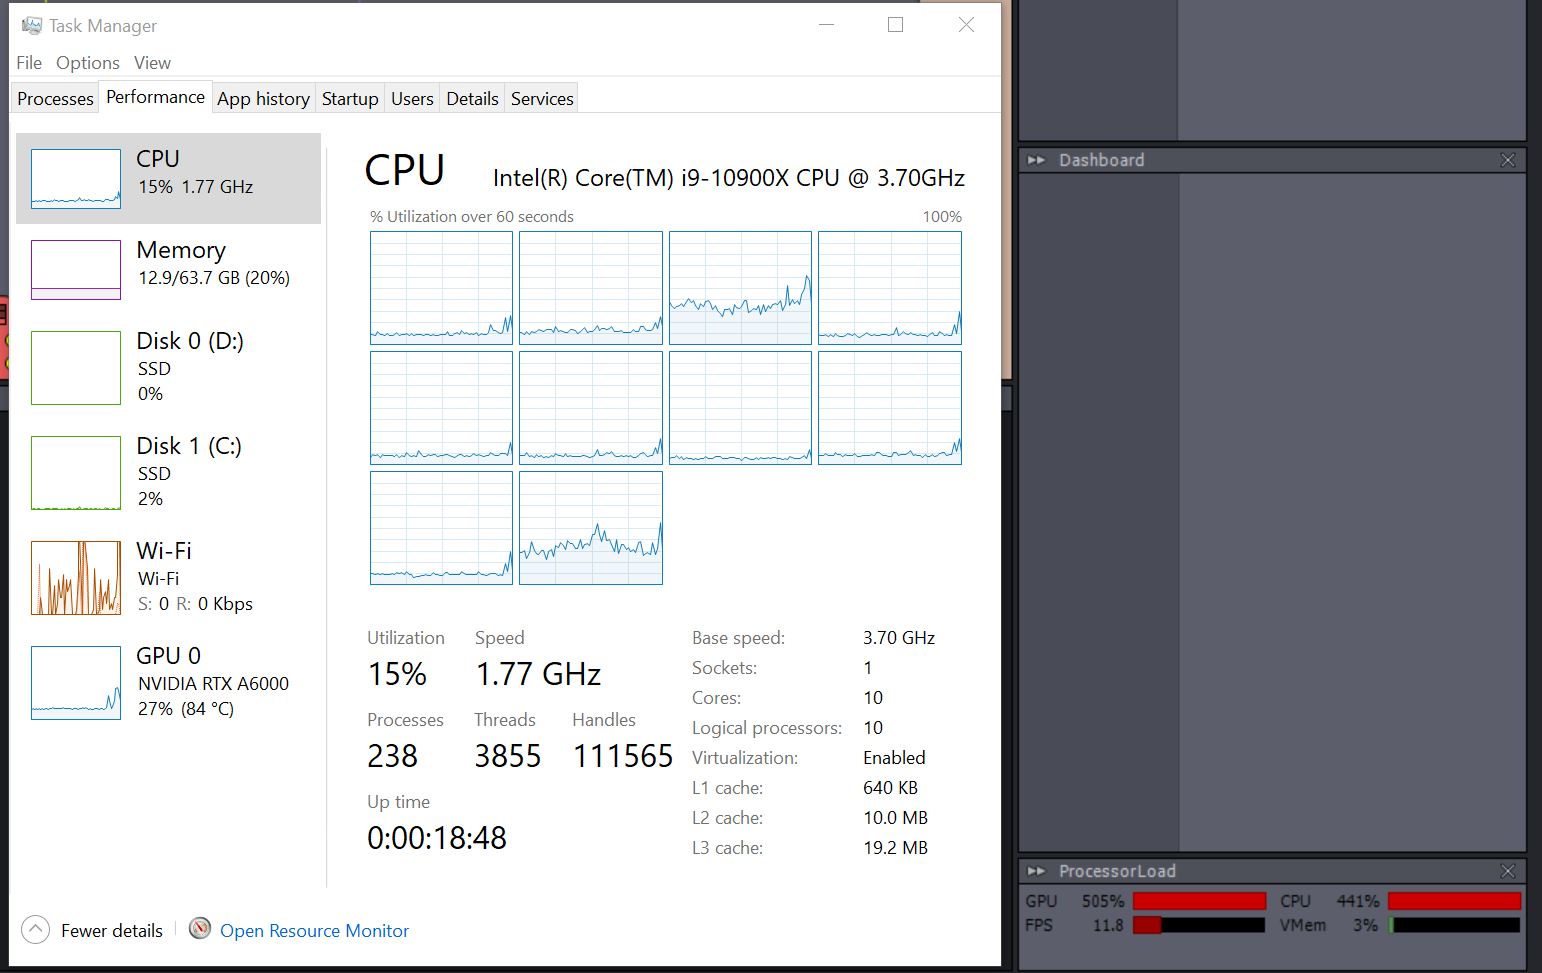
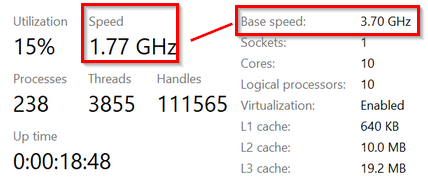
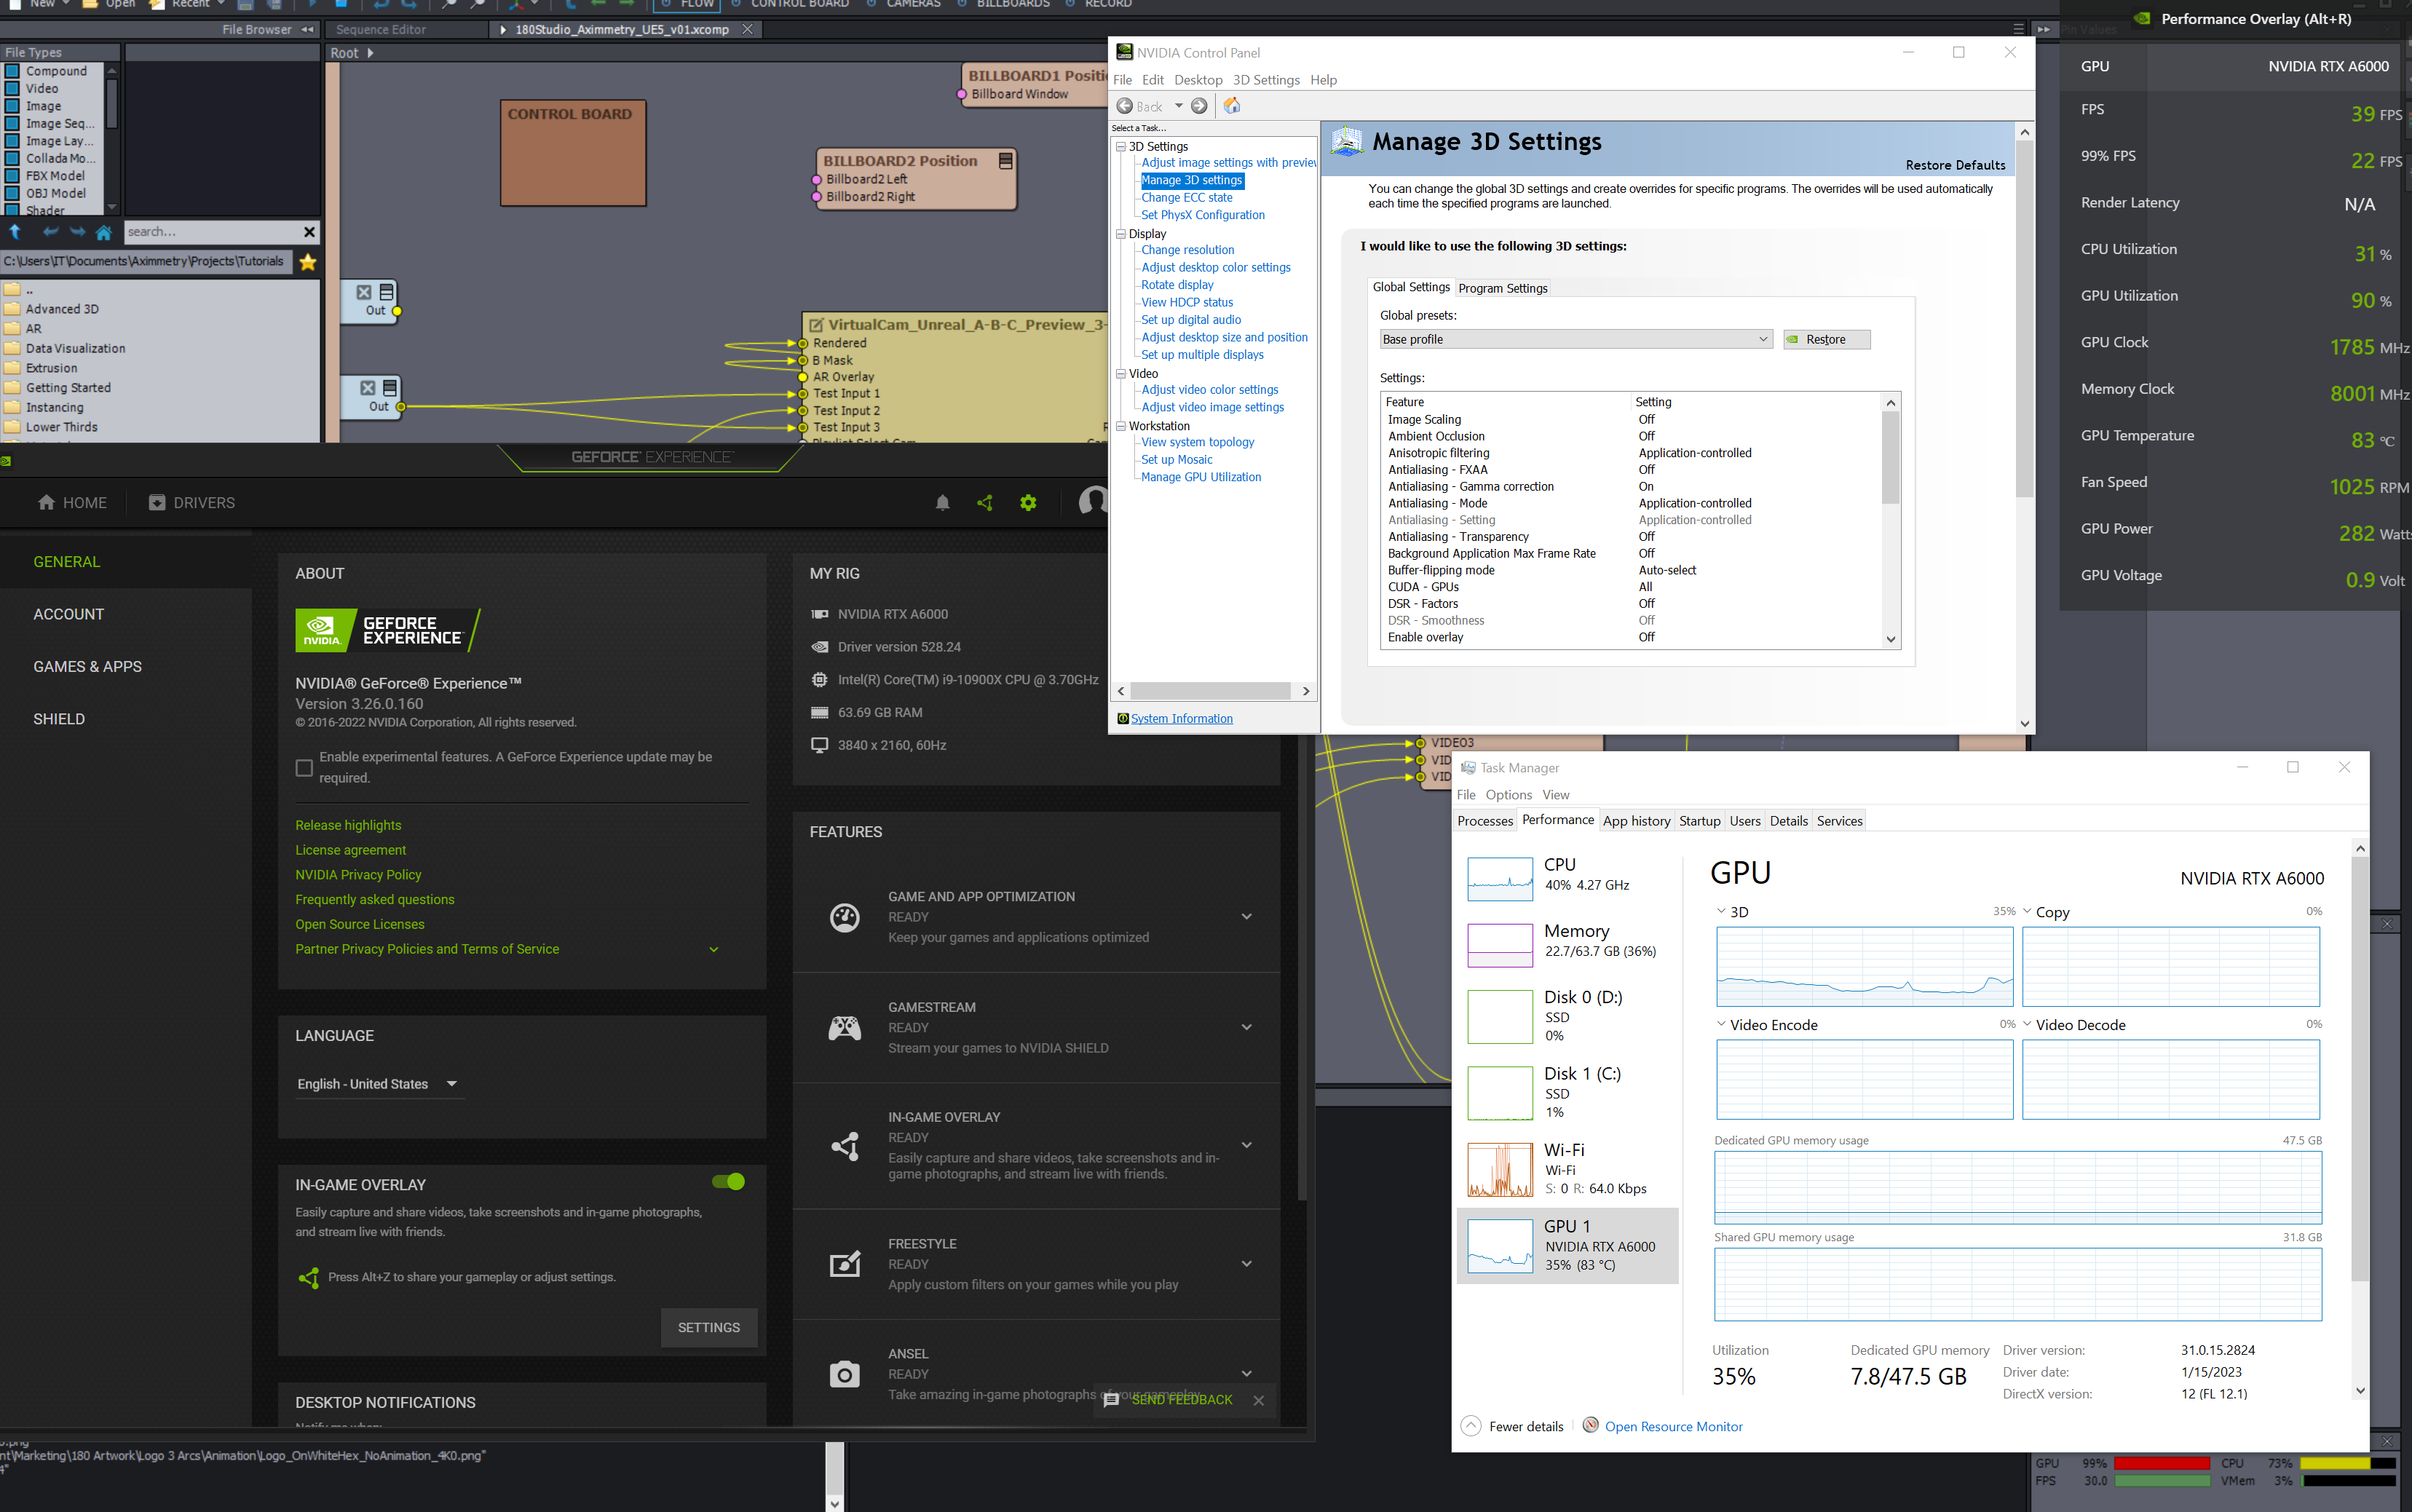
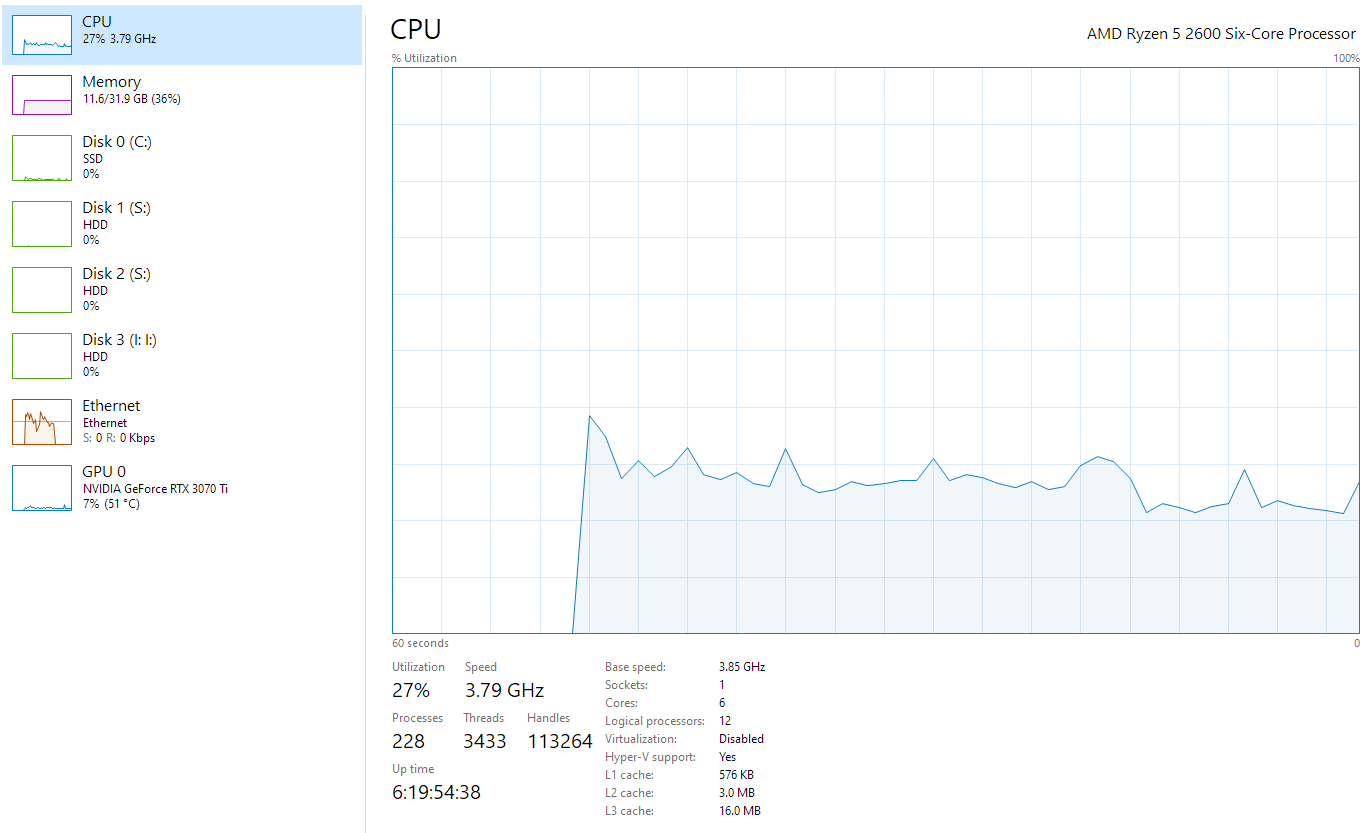
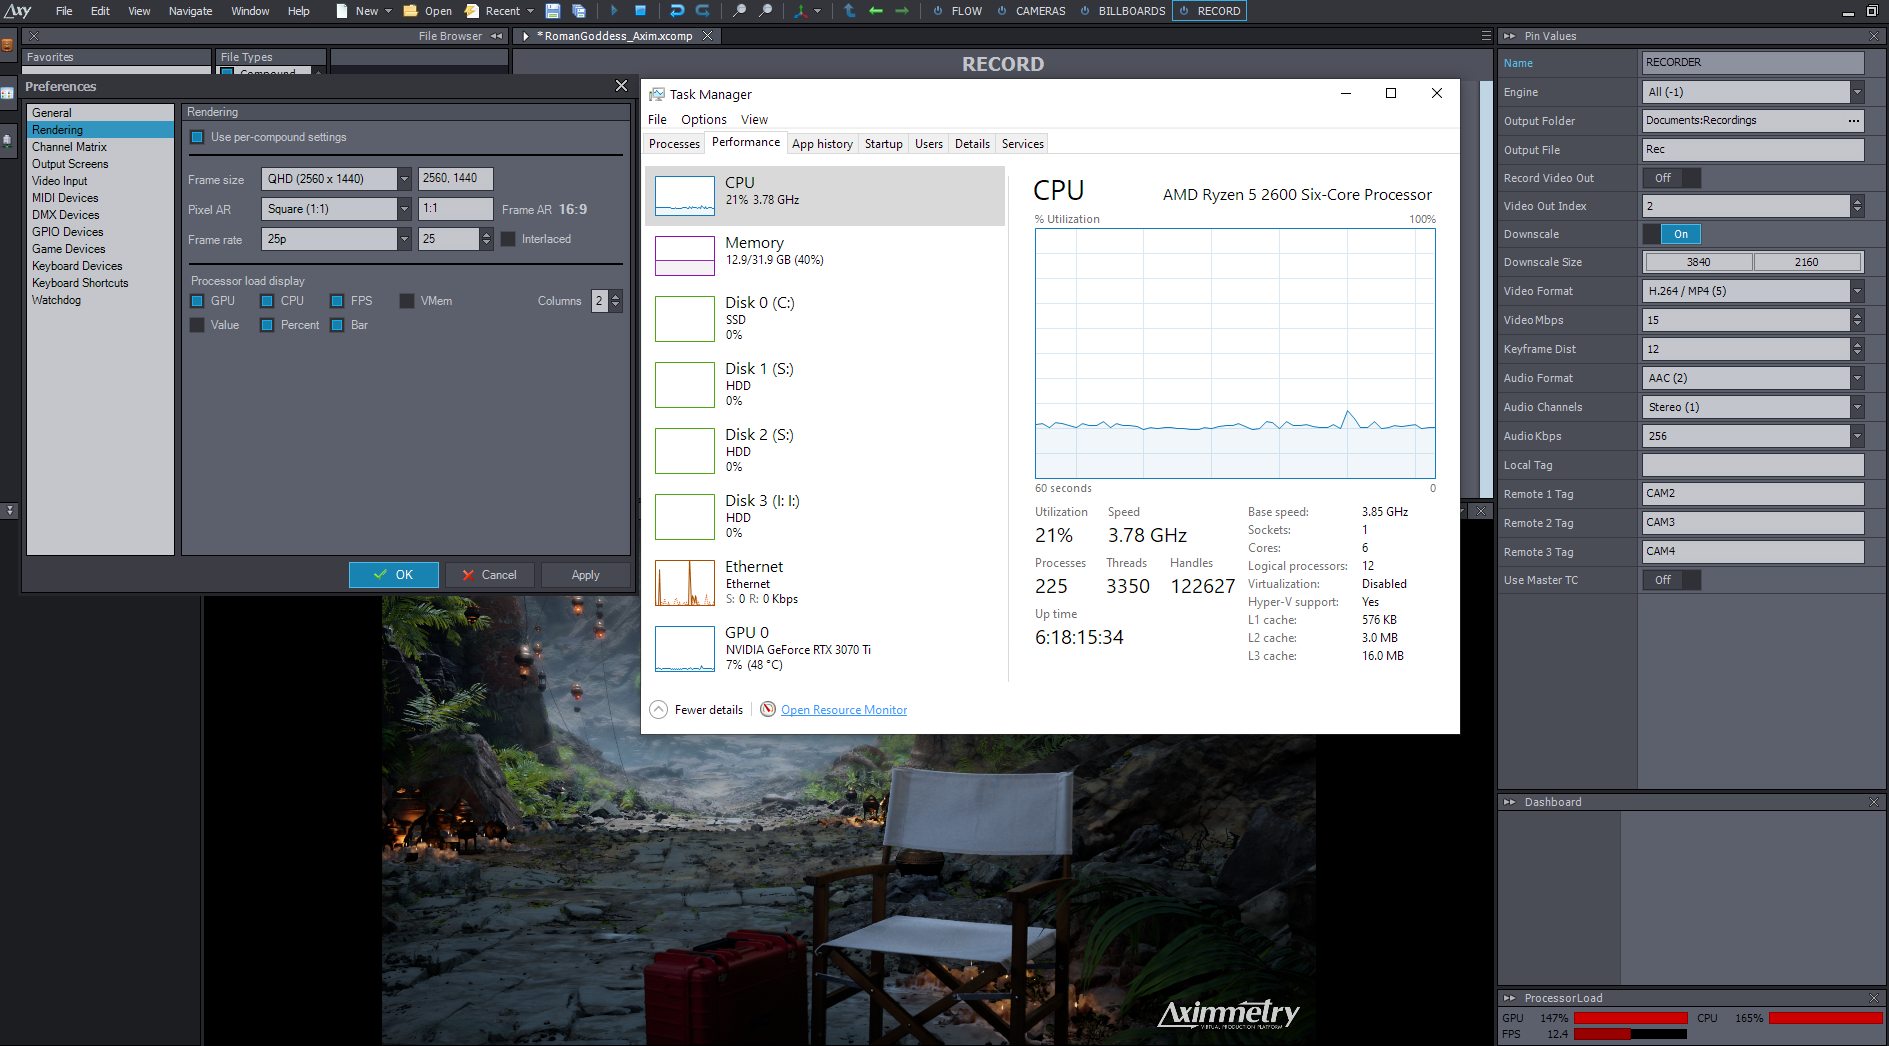
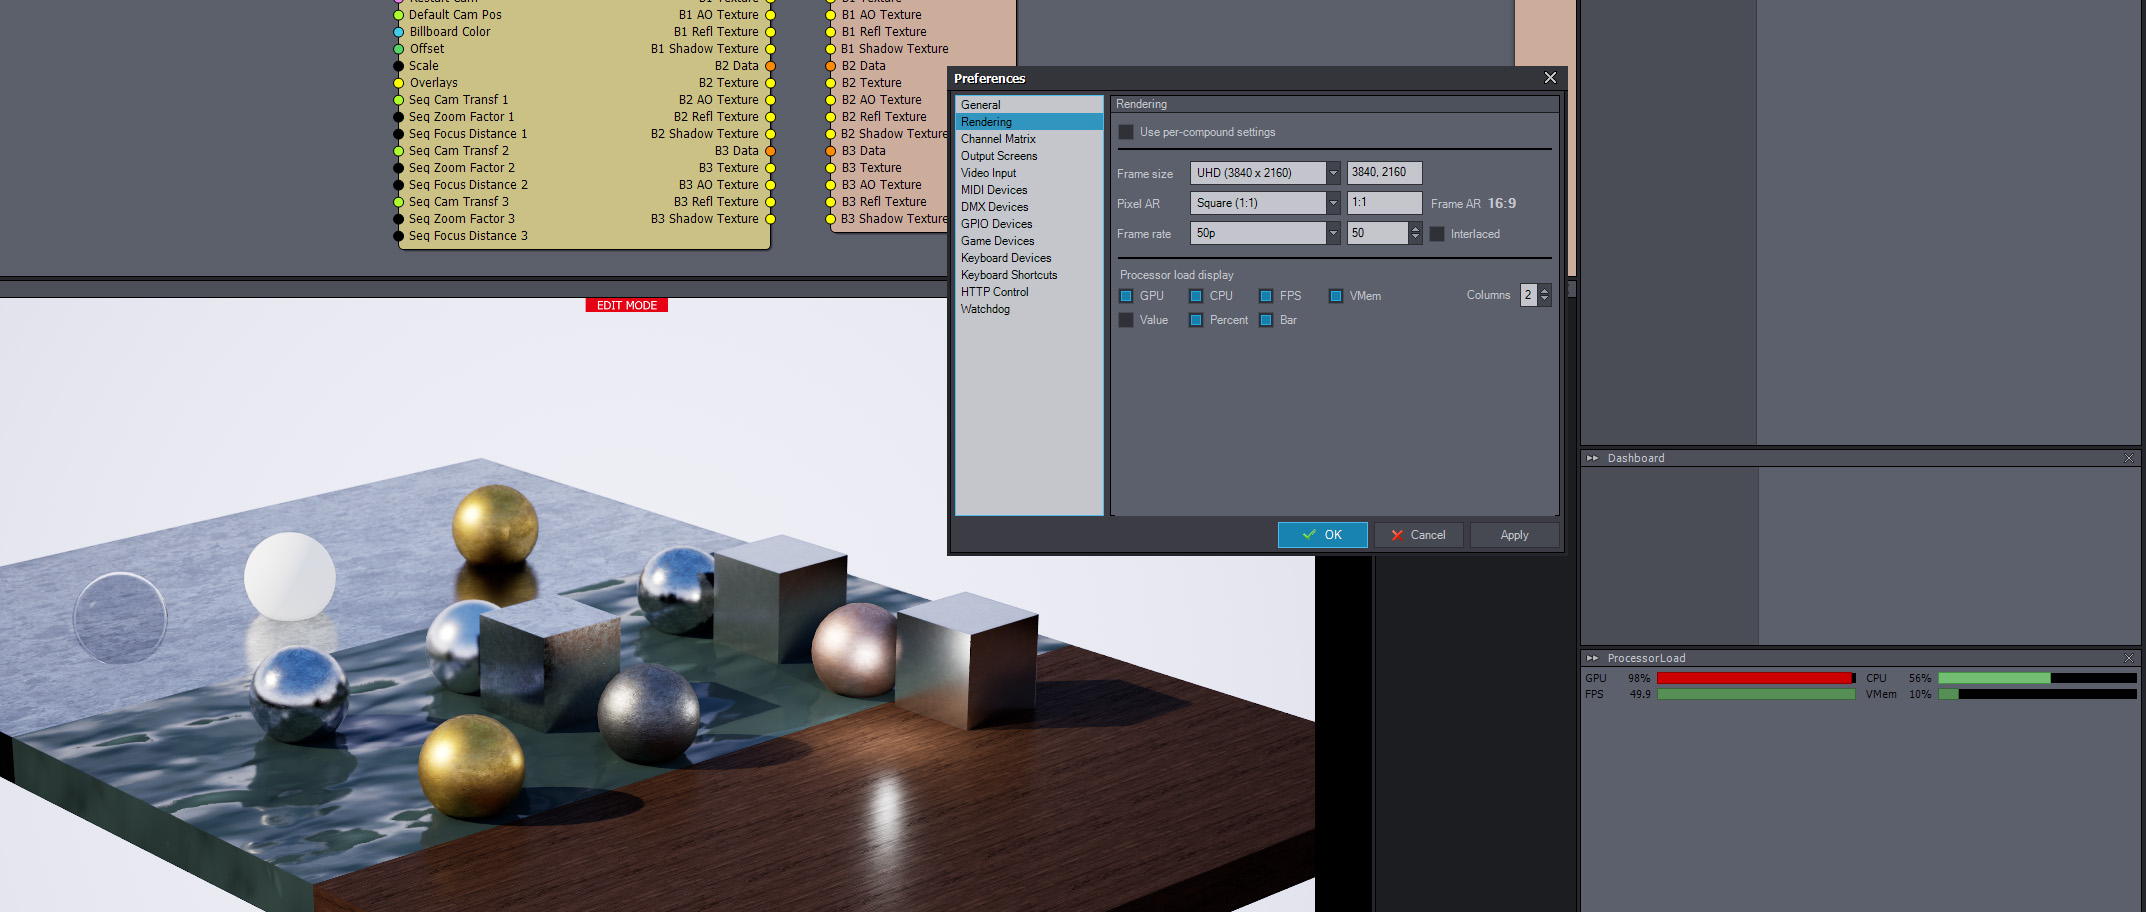
We have a very similar setup and I’ve noticed strange performance issues with UE5 as well. That being said, any scenes we’ve moved from 4.27 that doesn’t use any of the new UE5 features like Nanite or Lumen performs identical in the latest version. One thing that stands out is that your CPU speed is only at 1.77 Ghz. Do you have any power saving turned on in the system or in the BIOS? There are a lot of settings you can change to optimize for single core performance, so google optimizing bios settings for game performance on your motherboard.

If you’re able to share your project I can try to run it on one of our computers and compare the performance here. My email is johan.folke@twenty.se.

 
Profile Image
180Group
  -  

There has to be other things going on I am not aware of.  Opening my studio environment in Unreal for Aximmetry 5 my FPS looks to be capped at 30.  I can turn on and off Lumen, change to Raytraced, change Shadow Map Method, swap Antialiasing modes, change the frame rate min/max or desired rate and it never changes from 29-32 fps.   I can even go into the top right Engine Scalability settings and put it to low and it only improves to 34 fps.  I change it to Cinematic or Epic and its 28 fps.  The Task Manager shows the GPU at 10% and the CPU at 7%.   

I can tumble the viewport at insane speeds like butter and zoom in out with no glitching.  I am not getting the full power in my scenes and when I load it in Aximmetry the file performance is awful.

 
Profile Image
Eifert@Aximmetry
  -  

Hi,

According to the Task Manager, your computer is not loaded at all. While according to Aximmetry, it is overloaded by far.
I would guess that some windows setting is actually throttling your computer, which is why it doesn't show up in Task Manager.

Such a big difference between CPU Base Speed and Speed, suggests that you have energy-saving settings running even when your computer is being utilized:


Also, 84 °C for 27% utilization looks a bit high for A6000:


However, A6000 can run at temperatures even higher.

Note that Unreal viewports usually render at a much lower resolution than UHD or even HD. Most likely, if you run the Unreal project in the normal Unreal Editor at fullscreen, you will experience the same issue.

Warmest regards,


Profile Image
180Group
  -  

Thanks @Eifert

I followed these steps on this website https://www.minitool.com/news/cpu-throttling-issue-how-to-fix.html and it appears to have unlocked the full power of the CPU.


Is there anything I can do to the Nvidia settings and their Control Panel to unlock the full power of the A6000 as well? 


It still says the GPU is maxed out in Aximmetry but the task manager says there is still lots of unused power.  The Performance overlay from NVidia is probably more accurate but still shows a bit of a difference and perhaps there is performance that I'm missing out on.  When it ever crosses 100% the fps doesn't just drop a frame or two, it usually goes to half and does 15fps.  I just want the most reliable settings to make sure when shows are live it can maintain high quality and steady framerates.

 
Profile Image
Eifert@Aximmetry
  -  

Hi,

I suggest running the https://www.userbenchmark.com/ 's software, it can detect many different kind of problems with your hardware set up.

You could also reset your NVidia settings, you might have set something in there that causing this. Sadly, we have little expereince with A6000, so we can not really help more on this issue.

It is normal that Unreal's FPS is halved when you can not keep up with the targeted frame rate. Before the production, you should make sure that the GPU or CPU is not in the red, even after prolong usage of your project.

Warmest regards,

 
Profile Image
Sinemaya
  -  

Hi Johan,

Experiencing the same with this scene.. Both CPU and GPU maxed out.. no matter how downgrade the render output.. Any advice.? and +

Why it writes Video Port Limit Exceeded..?

And Using GameReadyDrivers or Studio Driver for Nvidia makes a difference.? Which to use.? 

Thank you.


Profile Image
Eifert@Aximmetry
  -  

Hi Sinemaya,

First, you should probably fix the source of the Too many messages in Unreal Engine Log message. It might be caused by something that also reduces your scene's performance.
You can display the Unreal Engine Log using the view menu:

Also, disable any energy-saving settings in Windows or in your hardware's drivers.


Video Port Limit Exceeded error message is likely caused by using SDI or NDI video. These video inputs and outputs are limited in certain licenses: https://aximmetry.com/products 


There is not much difference between GameReady Drivers and Studio Drivers. You don't have to worry about using either of them.

Warmest regards,

 
Profile Image
Sinemaya
  -  

Dear Eifert the log is as :  I have no power management either. A scene used to run at 4K with 25 fps is now behaving like so.. This is an issue came with 2023 update. Please help us in a way.. Best Regards.


Profile Image
Eifert@Aximmetry
  -  

Hi,

So it is likely an issue that happened from upgrading to Unreal Editor 5.1.

I would suggest running the project in Live Sync mode: https://aximmetry.com/learn/tutorials/for-aximmetry-de-users-unreal-engine-5/ue5-how-to-install-and-work-with-the-unreal-engine-based-de-edition/#interactive-editing
This way, you will be able to see the full Unreal log in the Unreal Editor. And see what is sending lots of log messages.

I have a hunch based on this log:

It could be that Screen Space Global Illumination turns on now, and before it was turned off and the scene only used baked lights. This would explain the performance difference.

Warmest regards,

 
Profile Image
Sinemaya
  -  

Dear Eifert,

I did live sync and the result is as:  Pls try to give me a good solution.. The system monitor is showing all green every resource is vast available but the scene in Aximmetry keeps showing maxed out.. and 12.5 FPS


Profile Image
TwentyStudios
  -  
@Sinemaya: As has been mentioned many, many times, the task manager doesn't give an accurate represntation of total system usage. You're most likely maxing out a single core, which would cause the dropped frames. Aximmetry and Unreal aren't really optimized for multi-threaded performance.
 
Profile Image
Sinemaya
  -  

Thank you Twenty Studios. Won't bother again.


Regards

 
Profile Image
Eifert@Aximmetry
  -  

Hi Sinemaya,

You can actually see each individual core in the Task Manager by switching to Logical processors:


I suggested using live sync to find out what is writing so many things in Unreal's output log that Aximmetry can not show them (Too many messages in Unreal Engine Log). It is likely warning messages that are related to why your scene is running slow.

Warmest regards,

 
Profile Image
michaeln
  -  

@180Group,

Did you fix your problem? my system is acting exactly like yours.. GPU 100percent the rest is fine... 

thanks,

Michael

 
Profile Image
tingan
  -  

ME to 

 
Profile Image
Quanjingwang
  -  

Such a simple scenario


Profile Image
Eifert@Aximmetry
  -  

Hi,

That is actually not really a simple scene if you are using complex reflection methods.
And even in the most basic scenario Unreal's Lumen lighting will consume a lot's resources, as by default Unreal's Lumen loads in and consumes lots of resources.
Also 50fps and 4k resolution are 2 times faster and 4 times more pixels than 25fps and FHD production, which roughly means 8 times more hardware resources are being consumed compared to 25fps and FHD.

Warmest regards,

 
Profile Image
michaeln
  -  

Hi Eifert, 

my project and output were set to 1080p @60fps

once lowered to 30fps, everything is great. But at 60fps, it hits the red marks for resources even though system is not running high actually..

 
Profile Image
ericmarodon
  -  

Does your video input source/camera have the same fps as your aximmetry project?

I noticed that having mismatched framerates was adding a lot of load on the system, as it probably has to convert things on the fly.

 
Profile Image
Techtonic_HK
  -  

I was having this issue earlier. The GPU usage went up 4 times in loading my set in Aximmetry. Even though I checked the frame rate setting in Aximmetry.

After iterations of trial and errors, I found out most likely the issue is related to the light quality that how you build your lights (bake light process) in UE. I switched to the light quality to "preview" and the problem has been resolved.

Anyone who has similar problem could try out this approach to see if that is the solution to the problem.

 
Profile Image
TwentyStudios
  -  

@ Techtonic_HK: It’s highly unlikely that baking lighting at Preview quality should make any difference compared to baking at Production quality. It’s still pre-calculated lighting in both cases. The only difference is what precision the baking is done at.